By David Svenson
May 2012 | view story as a .pdf
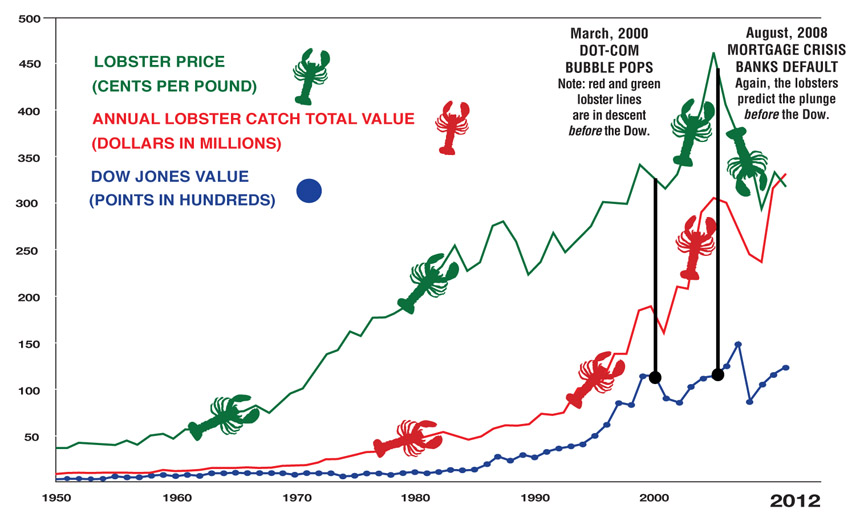
In the Roaring Twenties, when Wharton Business School’s George Taylor proposed his “Hemline Effect”–that as hemlines rise, so does the economy—he could also have taken a trip to the docks for similar insight. Because sales figures for fresh lobsters share an uncanny ability to predict market changes in the Dow Jones Industrial Average.
Why wouldn’t lobsters perform well in this murky business? As our graph illustrates, our CPAs of the sea (in red and green) called the bust of the dot-com bubble ahead of the stock market. Specifically, lobster prices steeply declined before the Dow Jones Industrial Average settled to 9,796 in March of 2000 from 11,722 as the year opened.
And who could detect subprime slime better than Homarus americanus? In 2007, while the Dow enjoyed a relative calm between 13,000 and 14,000 from mid-2007 to the end of 2007, the price of lobsters began its deep dive from just under $4.50 a pound to where it settled in mid-2009, at just under $3. This journey–fine for our pockets and celebratory dinners–began before the market dropped. After the silt settled, the Dow reached its trench of 6,547 (in March 2009, down from 13,058 in May 2008 and 9,015 in January 2009). Since then, the two concurrently started a climb.
“These correlations, I believe, are just a coincidence,” University of Maine economics professor Hsiang-Tai Cheng says. “The only thing I can think of is consumer confidence and sentiment before the economy goes south.”
On the other claw, “It’s very interesting, because others have found that a recession follows rising oil and food prices,” Cheng says. Perhaps, after all, there’s a little sage in the water.


0 Comments